Data First, 2025Q1 Offline Retail Express
Time flies, and in the first quarter of 2025, it quietly came to an end.
This week, we will make a resumption of offline retail consumption in 2025Q1. Among the reference objects involved, the year-on-year object is 2024Q1, and the month-on-month object is 2024Q4.
The data of the re-launch are all based on CT of the instant win brand.The offline retail monitoring network of instant win brand CT covers cities at or above the county level (excluding townships, towns and villages), and deeply covers the core urban agglomerations of the country, including hypermarkets, supermarkets, small supermarkets, convenience stores and grocery stores. Win immediately through AI and big data technology to automatically clean the real-time full POS data of the transaction orders of sample stores. At present, there are more than 300,000 brands monitored in the instant win brand CT, with more than 14 million bar codes and more than 5 billion orders per year.
In order to ensure the consistency of the data sample range in each quarter, the data sources of the stores used this time are all continuous stores, that is, these stores were active in the offline retail monitoring network before April 2025. The sample sizes of stores in 2024Q1, 2024Q4 and 2025Q1 are the same.
For the quarterly offline retail express in 2024, please click:
Data Launch: 2024Q4 Offline Retail Express/Data Launch: 2024Q3 Offline Retail Express/Data Launch: 2024Q2 Offline Retail Express/Data Launch: 2024Q1 Offline Retail Express
1, the overall situation of the quarter
We selected four categories: food, beverage, wine and daily chemical, and observed the overall year-on-year situation of the quarter based on the continuous store samples.

First of all, the situation in this quarter, in terms of sales, the number of orders and the average cost of orders, 2025Q1 compared with 2024Q1, all indicators have declined to varying degrees. An obvious change is that sales decreased by 10.44% year-on-year, but the number of orders decreased by only 5.35% year-on-year, which means that the average amount of each order decreased significantly year-on-year, and consumers’ shopping budget for a single order still showed an obvious shrinking trend.
Another noteworthy point is that the annual Q1 usually includes the Spring Festival, which is also the most important festival consumption node in a year.
From the subjective point of view, festival consumption is usually affected by emotion and scene more than the so-called "just need" in weekdays, which may also indicate that consumers’ income expectations and optimism for the future are still being repaired in Q1 this year.
From an objective point of view, the rise of emerging formats such as snack discount and discount supermarkets, as well as the continuous increase of online penetration rate, have also produced a certain degree of "diversion" for the consumption of traditional retail formats, and this change may also continue.

From the ring comparison, compared with 2024Q4, it is also influenced by the Spring Festival, and the sales volume and the number of sales pieces have increased obviously, but the number of orders has not increased obviously, or it means that the above-mentioned problems of consumers’ expectations and shopping willingness, as well as the objective business diversion, have also caused a certain degree of impact.
In addition to the factors mentioned above, price is also one of the important factors that affect the change of sales.
Based on the price trends of food, beverage and wine in the instant win price index, we can also see the pressure of price changes on sales growth. In the immediate win price index, 100 is the price index baseline. A price index above 100 means that the overall price level of the category is higher than that of the same period last year, while a price index below 100 means that the overall price level of the category is lower than that of last year.
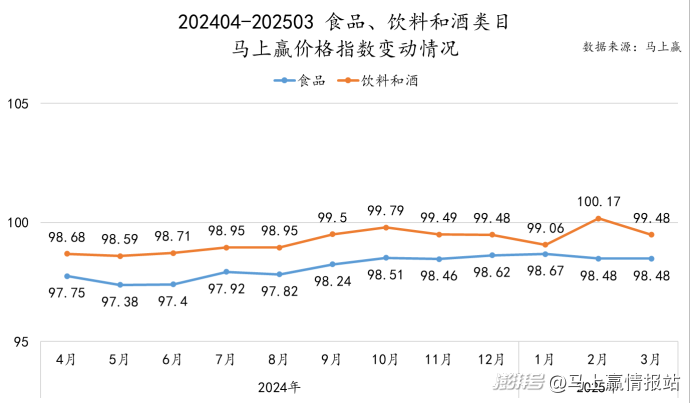
It can be seen that in January-March of 2025, except for drinks and wine, which were temporarily higher than 100 in February (or because the Spring Festival was misaligned with the Spring Festival in 2024), the price indexes of food, drinks and wine were all lower than 100 in the other months of 202404-202503, which means that the overall price levels of the two categories are in a continuous downward channel, and the food category is compared with the drinks and wine category.
Generally speaking, the main factors that promote the growth of consumer goods from the supply side are nothing more than "selling more" and "selling more expensive". Based on the overall monitoring of the five major retail formats by Win Now, the dispersion of formats and the outflow of demand from formats certainly constitute objective reasons, but in terms of sales scale and sales price, several categories as a whole are also facing greater pressure.
(1) Key categories
In order to further observe the situation, we selected some categories of packaged goods with large sales scale in offline retail channels from the above categories, and observed the changes in the share and importance of the categories through the year-on-year changes in the share of these categories in the corresponding categories. In terms of category selection, because this quarter includes the Spring Festival, it is slightly adjusted compared with 2024Q4.
Food category:
Dairy products: pure milk, yogurt, adult milk powder.
Leisure snacks: nuts, roasted seeds and nuts, chocolate, puffed food, biscuits, dried meat, candies and western-style cakes.
Instant food: instant noodles, instant vermicelli, instant sausage and self-heating food.
Quick-frozen food: quick-frozen glutinous rice balls, quick-frozen jiaozi, quick-frozen steamed stuffed buns and quick-frozen snacks.
Beverage category:
Milk-containing drinks, packaged water, vegetable protein drinks, soft drinks, instant fruit juice, sports drinks, instant tea, vegetable drinks, instant coffee and instant milk tea;
(2) Year-on-year comparison of 2)2025Q1/2024Q1-food category
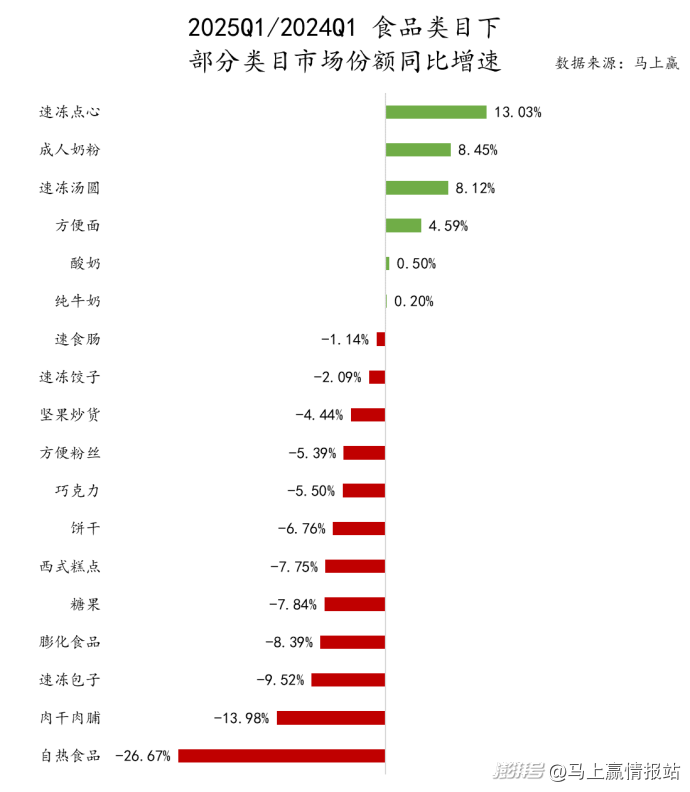
Judging from the year-on-year changes in the market share of food categories, the categories with positive year-on-year growth in market share include quick-frozen snacks and quick-frozen dumplings in the category of quick-frozen foods, instant noodles in the category of convenience foods, and adult milk powder, yogurt and pure milk in the category of long-lost dairy products; The market share increased negatively year-on-year, including quick-frozen jiaozi and quick-frozen steamed buns in quick-frozen foods, instant sausage, instant vermicelli, self-heating foods in convenience foods, and all categories under leisure snacks.
Further analysis based on the above performance:
All kinds of orders in quick-frozen food show uneven performance. Among them, quick-frozen dim sum once led a lot of categories in the year-on-year growth rate of market share in 2024Q4, and it also led this quarter, and the quick-frozen glutinous rice balls performed well. Compared with quick-frozen jiaozi and quick-frozen steamed buns, the year-on-year growth rate was negative, which further confirmed the changes of consumers’ consumption scenes of quick-frozen food and their roles in household consumption.
Dairy products have ushered in a long-lost market share of all key categories, with a positive year-on-year growth rate. Among them, adult milk powder is still the leader. Comparatively speaking, although the market share growth rate of pure milk and yogurt is positive year-on-year, its growth rate is very small. On the other hand, after a period of "difficult period", dairy products seem to be welcoming their own "turning point", which may also bring trend changes to the subsequent development of the category, which deserves continuous attention;
Convenience foods are showing a trend of differentiation. Among them, the market share of instant noodles is still increasing year-on-year, while the market share of fast-food sausage and convenience fans is decreasing slightly year-on-year. It is noteworthy that this type of product has been in a "stall" state since the outbreak of hot food. From the situation this quarter, this stall has not improved.
Finally, the category of leisure snacks, all sub-categories under the category of leisure snacks showed a year-on-year decline in market share. On the one hand, the differentiation of demand in snack discount, independent stores and online has led to a great impact on the sales of leisure snacks in the traditional five formats; On the other hand, leisure snacks are always in a slightly embarrassing position in today’s healthy wave, which may be one of the reasons why consumers are less and less important in the overall food consumption;
(3) Year-on-year comparison of 3)2025Q1/2024Q1-beverage category
In the first quarter of each year, because it is in the low season of the traditional beverage industry, and it contains the important festival of the Spring Festival, there are many differences between the beverage categories and the overall situation of the whole year. At the same time, in 2025Q1, the key categories in the beverage market also showed some changes.
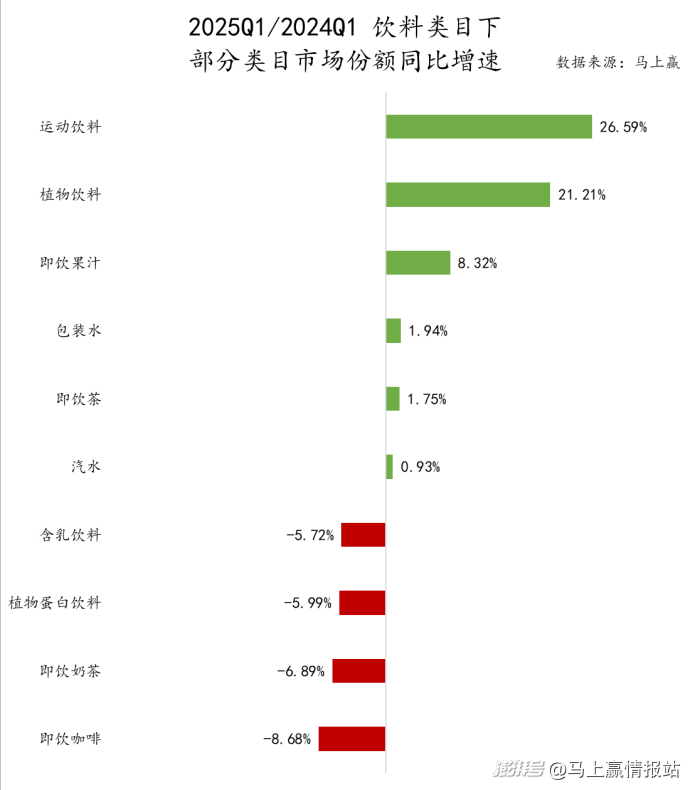
It can be seen that the categories of beverages with negative year-on-year market share growth rate are milk-containing beverages, vegetable protein beverages, instant milk tea and instant coffee. In the past, these categories performed well in winter or had strong attributes of holiday gifts, but their performance this year was not optimistic. At the same time, sports drinks, plant drinks, ready-to-drink fruit juice, packaged water, ready-to-drink tea and soft drinks are the categories with positive year-on-year market share growth. These categories are more powerful in summer and have limited gift attributes, but their performances are remarkable.
This may also represent some trends in the development of the beverage market: on the one hand, the influence of seasons on consumers’ product selection in beverage categories may be gradually weakening, and products that relieve summer heat may also have a wide demand and market in the cold winter; On the other hand, the gift-giving nature of beverage categories may also be weakening. During the festive season, more beverage consumption scenes have changed from gifts from relatives and friends to party sharing, and the well-sold product categories have naturally changed from the past strong gift-giving categories to categories with more personal consumption. These changes may mean some trends in the development of the beverage market.
Based on the four categories of food, beverage, wine and daily chemical, and the performance of the typical categories listed above, we will further analyze the data from three latitudes: "people" with retail orders as the core, "goods" with commodities as the core, and "market" with business channels as the core.
2. "People": retail order dimension
In the observation of order dimension, based on the above-mentioned typical categories of food and beverage, we extracted all the consumer orders with these typical categories in all orders in the quarter, and extracted the dimension data such as order quantity, category sales and category sales.
(1) Year-on-year sales volume, sales volume and order quantity
In this quarter’s retail express, for the convenience of classified viewing and comparison, we also divided the three indicators of sales volume, number of pieces sold and number of orders into food category/beverage category for separate observation.
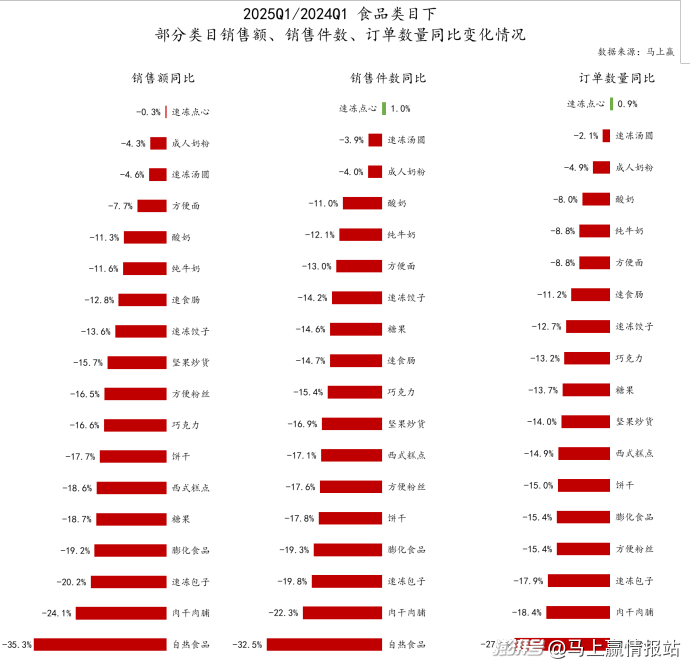
First of all, the food category, we can see that in all key categories, except for the number of frozen snacks sold/orders slightly positive, all other categories showed a decline. Combined with the above-mentioned year-on-year decline of -10% sales in the market, the overall situation of quick-frozen snacks, adult milk powder, quick-frozen glutinous rice balls and instant noodles is slightly better than that in the market.
The categories with poor performance are self-heating food, dried meat, quick-frozen steamed buns, puffed food, etc. Among them, the sales of self-heating food in 2025Q1 compared with 2024Q1, the number of sales under continuous stores decreased by 35%, the number of sales decreased by 32.5%, and the number of orders decreased by 27.5%. This figure is very exaggerated and it is also very serious for the category. After the epidemic, this category of products and related manufacturers will be in the end.
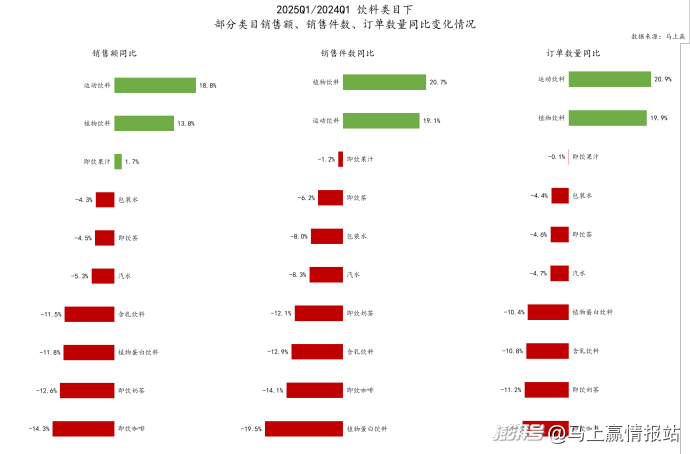
Compared with food, the highlight category of beverage category is more prominent. In terms of positive growth, the growth momentum of sports drinks and plant drinks is similar, with the year-on-year growth rate of sales exceeding 10%, and sports drinks have been growing continuously for many years since around 2022, which deserves continuous attention. The performance of ready-to-drink juice this quarter is also remarkable, which may be related to its increased penetration in festivals and other scenes. In the past two years, ready-to-drink juice has been continuously used in many ways, such as multi-specification, multi-combination, party scene marketing, and health concept marketing, so that more types of products appear on the dinner table shared by parties, and even replace the stable position of soda and vegetable protein drinks on the dinner table to some extent.
From the perspective of decline, the obvious decline is still in the categories of milk-containing drinks, vegetable protein drinks, ready-to-drink milk tea and ready-to-drink coffee. Among them, the instant milk tea/ready-to-drink coffee immediately won a special study in mid-March (looking forward to 2025, ready-to-drink coffee/ready-to-drink milk tea: why do bottled products "fall behind"? ), vegetable protein drinks and milk-containing drinks are more traditional categories, lacking innovation and product-based growth momentum, making it difficult for scenes and people to expand continuously, or these traditional categories are "headaches".
There is also instant tea that needs special attention in this quarter. Before the summer of 2025, the sales volume, the number of pieces sold and the number of orders for ready-to-drink tea were all negative year-on-year, and the decline of the number of pieces sold > the number of orders > the sales volume, which is not a good signal for the category that grew rapidly last year, and needs continuous attention.
(2) Average cost per order and year-on-year change
The average cost per order can reflect the average shopping budget of consumers in this category, and the change of this value can also reflect the change of consumer price expectation and consumption expectation of this category (more emphasis is placed on describing the price expectation of consumers in this category).
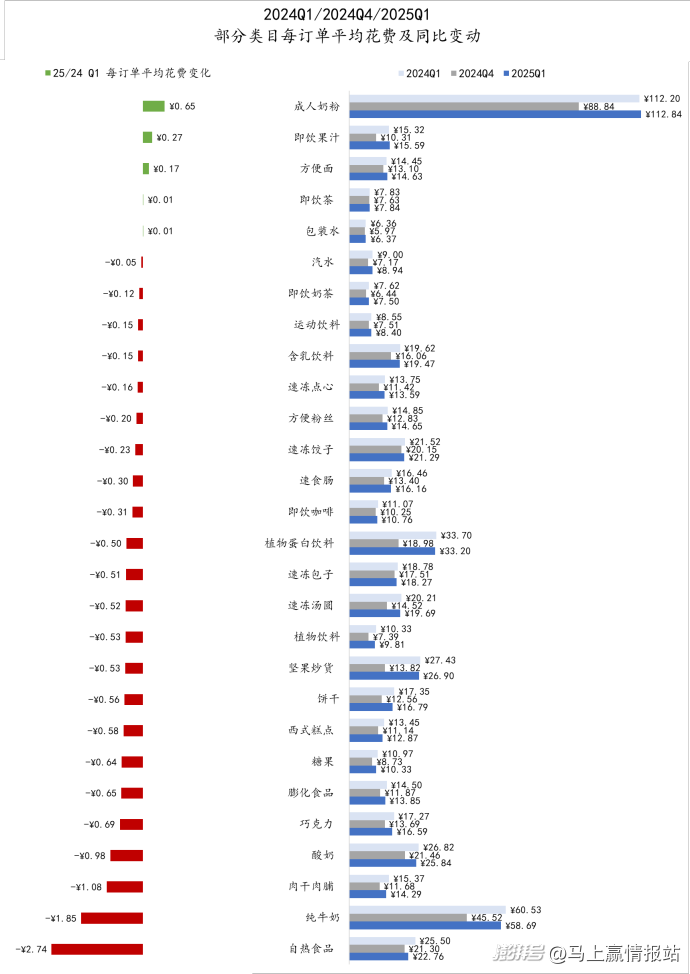
Judging from the year-on-year changes in the average spending per order of various items in this quarter, compared with 2024Q4, the average spending is at a high level in both 2024Q1 and 2025Q1, and the main influencing factor may come from the impact of the Spring Festival on consumer demand and shopping budget.
From the perspective of various purposes, only the average expenditure of adult milk powder, ready-to-drink juice, instant noodles, ready-to-drink tea and packaged water has increased slightly, while most of the other categories have shown a year-on-year decline, which also echoes the price index of food and beverage that has been seen before for a long time below 100. The lower the price level, the shrinking the consumer’s shopping budget in the category and the corresponding degradation of the supply side. At present, this vicious circle may still exist.
Judging from the year-on-year decline, most snack categories have shrunk to a certain extent under the condition that the absolute value of the average cost per order is not high. In the past one or two years, with the popularity of white-brand products represented by snack discount format and the low concentration of most snack categories, leisure snack categories have become the "hardest hit" for price pressure transmission.
Another thing that deserves attention is pure milk and self-heating food at the tail. Combined with the changes of market share, sales volume and order quantity of these two categories, it seems that pure milk has got some positive feedback in the process of exchanging price for quantity, and the scale has been kept from falling with a part of price decline; Self-heating food category is not optimistic, even if the average cost per order has dropped by about 10%, the share, sales volume and order quantity still decline seriously.
(3) Average number of purchased pieces per order and year-on-year change
The average number of purchases per order can reflect the average single purchase of consumers in this category, and the change of this value can reflect the change of consumer’s consumption expectation and consumption price elasticity (more emphasis is placed on describing the change of consumer’s consumption in this category).

Similar to the year-on-year average cost per order, the average number of items purchased per order in 2024Q1/2025Q1 is also higher than that in 2024Q4, but the difference between Q1 and Q4 is not as big as the average cost per order. This may also reflect that between "spending more money" and "buying more goods", festivals have a greater impact on the former than the latter.
Judging from the situation of various items in the quarter, only three categories of adult milk powder, plant drinks and quick-frozen snacks showed a positive increase in the average number of items purchased per order, but the growth rate was almost negligible, while the other categories showed a decline as a whole.
Among the key categories, the vegetable protein beverage dropped the most. The traditional strong festival mental category in this beverage category dropped by about 10% in the average number of purchases per order. Perhaps its mind is being challenged in both the Spring Festival gift and the winter hot drink scene. Under the background that the festival beverage market is changing from "gift" to "gathering and sharing", vegetable protein drinks seem to be a little behind in terms of product types, specifications or combination methods, and many consumers’ minds about this kind of products even remain on the traditional concept of "iron cans are heated"; On the other hand, under the tide of beverage health, although the plant protein beverage is backed by the word protein, its deep cultivation in the concept of health is limited as a whole. In recent years, the only "oat milk" that has made achievements has gradually turned to the TO B channel because of the mediocre market feedback, and the concept of product health in the category may have greater room for upgrading in the future.
3. "Goods": Top SKU and category new product dimension
In the observation of "goods" with goods as the core, based on the typical categories of food and beverage mentioned above, we have drawn the market share of these categories in this quarter, the changes compared with last year, and the new products of these categories.
(1) TOP SKU of various projects and same/quarter-on-quarter changes
The first is the TOP SKU. In the following table, the TOP SKU is the category of 2025Q1, which is 2024Q1 year-on-year and 2024Q4 quarter-on-quarter.
In terms of the same/chain-on-chain change, "-"means that the SKU is ranked in the same time period as the previous one, "new" means that the SKU was listed for the first time in the same/chain-on-chain last quarter (does not mean that it is a new product), "↑" means that the SKU is ranked higher in this quarter, and "↓" means that the SKU is ranked lower in this quarter.
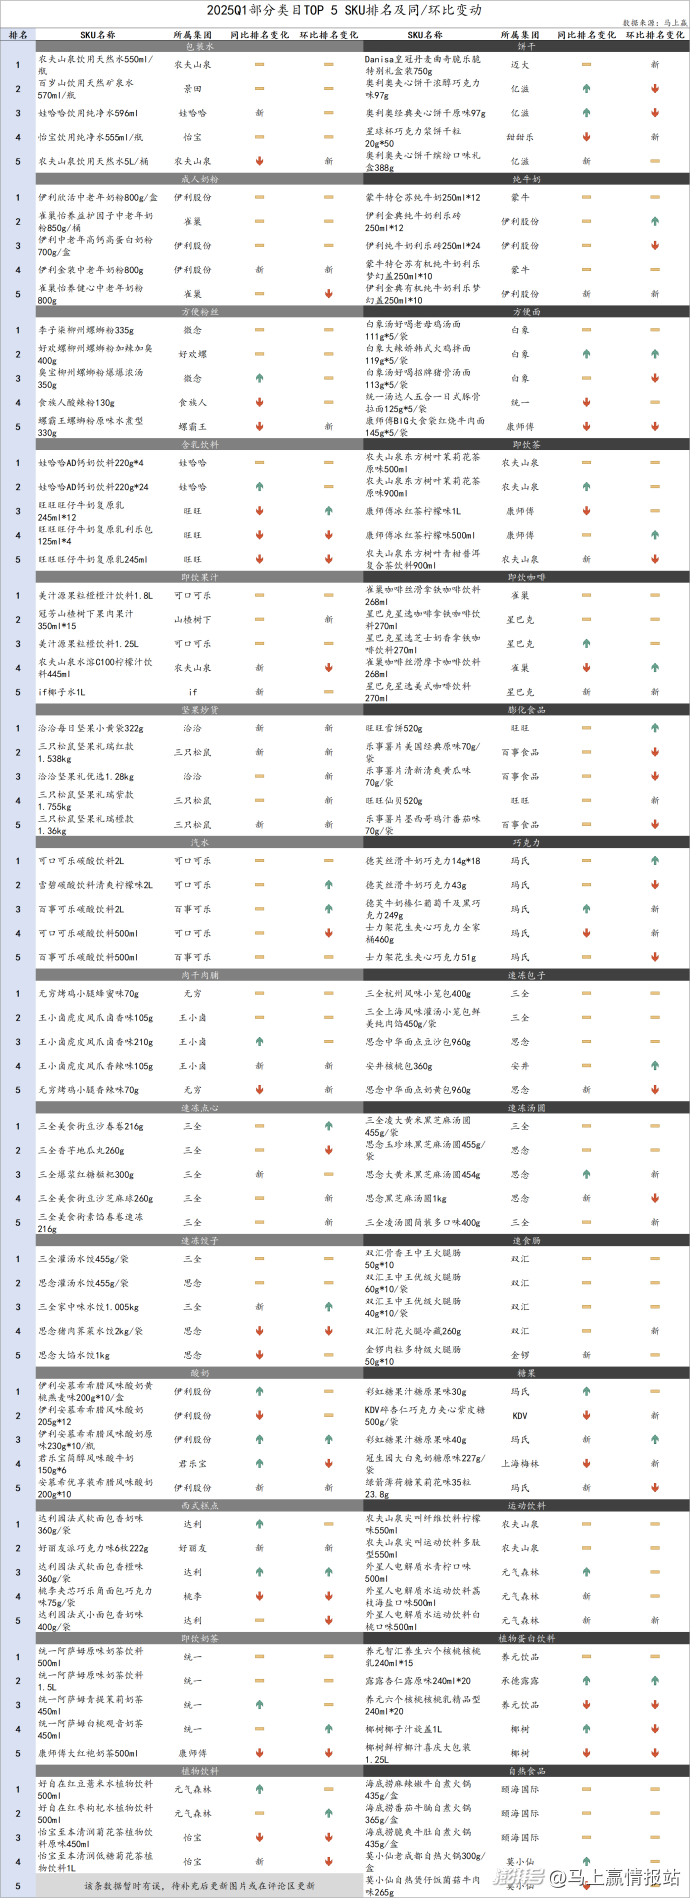
In the change of Top SKU this season, several changes are worthy of attention:
Instant noodles: the ranking of white elephant big spicy turkey noodles was further improved. Turkey noodle, a type of instant noodle product, was pioneered by South Korea Sanyang, but it was quickly promoted by white elephants in the local area and accepted by consumers. It is also a typical case of "combination of Chinese and Western" in the food industry. Win Now will carry out special research on Sanyang and White Elephant around the product category of turkey noodles in April, so please pay attention;
Nut roasted seeds and nuts: Because Q1 includes the Spring Festival, the TOP SKU of nut roasted seeds and nuts category is almost occupied by gift box products, among which three squirrels and three gift box products are on the list, with a rapid momentum.
In several categories of the whole quick-frozen food (quick-frozen jiaozi, glutinous rice balls, steamed stuffed buns and dim sum), all TOP SKU belong to Sanquan, Anjing and Missing only, and the head group of the category has a very strong control over the category.
Plant beverage: The performance of Yuanqi Forest from Red Bean Coix Seed Water/Jujube Lycium Juice has been further improved, ranking first and second in this quarter’s TOP5 SKU. Relatively speaking, the old rival Ipoh’s Zhiben Qingrun Chrysanthemum Tea series products have all declined in the ranking. (The fifth category to be supplemented)
(2) The quantity and share of new products changed year on year.
In this new category, we will observe the innovation activity and new product growth from two dimensions: the number of new products on the market and the market share of new products. The definition of "new product" by instant win brand CT is the new product information and bar code that was first registered in the offline retail monitoring network of instant win in this quarter.
Through the number of new products on the market, the market share growth of new products in the past and the share of new products in the current season, we can clearly understand the innovation and new product acceptance of various projects.
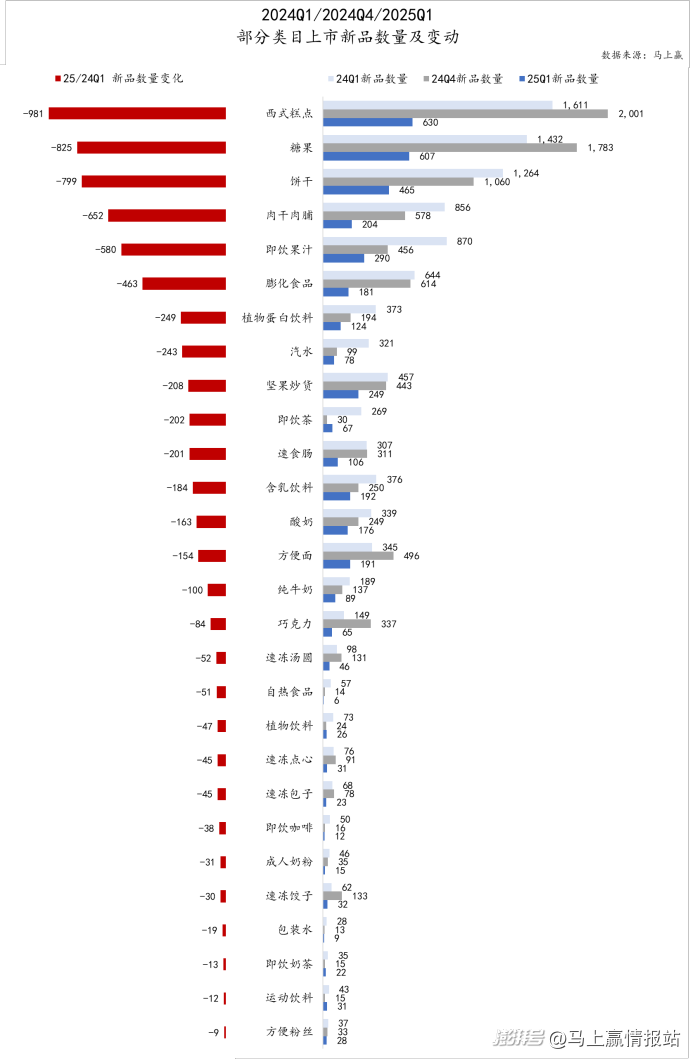
In terms of the number of new products, the number of new products listed in all categories showed a significant year-on-year decline. The categories that have increased in decline are western-style cakes, sweets, biscuits, dried meat, instant fruit juice, puffed food, etc. Among them, leisure snacks account for the vast majority of the categories with a large decline, and the number of new products in some categories has even dropped by more than 50% year-on-year, which is a real reduction in the number of new products.
Looking back at the number of new products in key categories in the quick reports of previous quarters, we find that the number of new products in most categories has been declining, and the reasons may be more critical:
?Oversupply and involution:Today, most food and beverage categories are already in the environment of complete market competition, and the related supply chain and product research and development are no longer barriers. Compared with a new product, it is a more difficult challenge to really support a new product, which also objectively creates the competitive situation of "thousands of troops crossing the wooden bridge". However, looking at this cycle in reverse, the overcrowded track and the low success probability of new products make brands/manufacturers not willing to promote new products, so it is difficult for the number of new products to grow rapidly.
?Industry dividends subsided:During the period from 2017 to 2022, innovations in consumer goods and new products based on raw materials, concepts and even brands and marketing did emerge one after another. However, with the decline of dividends and the slowdown of consumption upgrading, the scale competition and channel barriers of consumer goods made the new products face a rather unequal competitive environment when facing the old products. When the tide faded, this disadvantage became more obvious and insurmountable.
?SKU reduction and "head" strategy;In the retail market in 2024, adjustment and reform are undoubtedly the key words. All adjustment and reform directions are inseparable from the core strategy of "reducing the number of SKUs and increasing the proportion of head SKUs". Under this background, especially for categories with high concentration, the shelf space that channels can give new products is facing further compression, which leads to the continuous reduction of the number of new products listed.
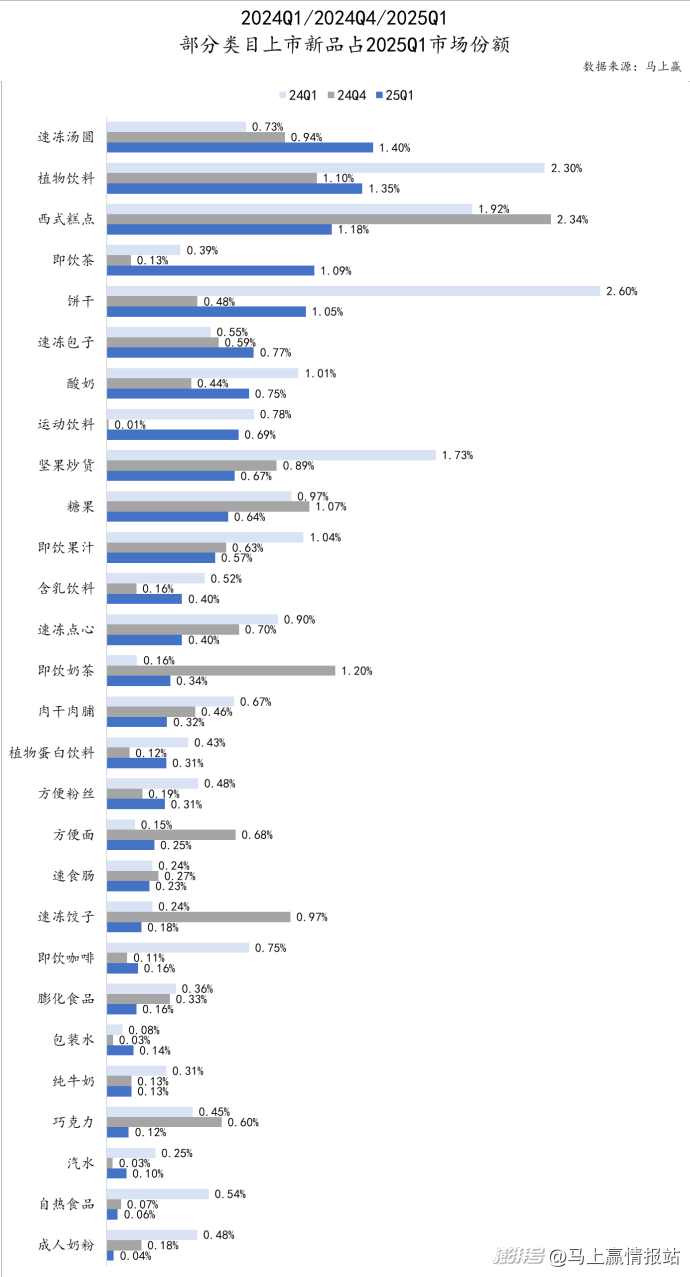
The reduction of the number of new products on the market is inextricably linked with the survival and development performance of new products in the category, and the two sides are mutually causal and influential. Judging from the market share of new products in several quarters, biscuits, western-style cakes and other categories, as well as nuts, roasted seeds and nuts, plant drinks and other categories, have shown better survival performance of new products.
On the contrary, in several categories with high concentration and strong head brands, such as packaged water, pure milk, soft drinks, etc., whether it is the new products in Q1 and Q4 last year or the new products in this quarter, their living conditions are worrying and they are facing greater competitive pressure.
4. "Field": the dimension of format and city level.
In the part of "market", we go back to the categories of food, beverage, wine and daily chemical, and observe the year-on-year performance of various formats and cities under the collection of large categories.
(1) City-wide grade and year-on-year situation of each format.
The CT offline retail monitoring network of instant win brand collects and analyzes data based on five formats: hypermarkets, supermarkets, small supermarkets, convenience stores and grocery stores. We also extract the sales, order volume and average order cost of these five typical offline retail formats in this quarter and the previous quarter.
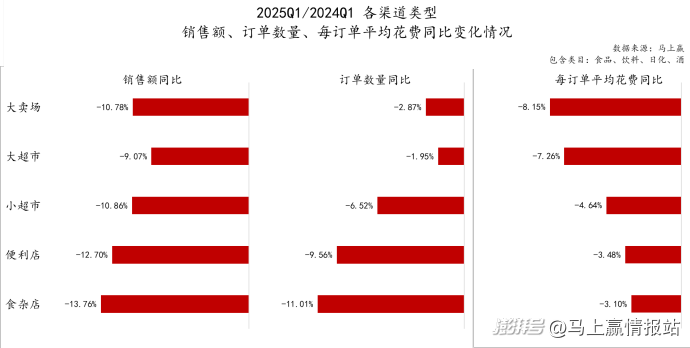
In this quarter, no matter the sales volume, the number of orders or the average cost per order, all formats showed a relatively obvious year-on-year decline.
Compared with the year-on-year comparison in 2024Q4/2023Q4, the year-on-year decline in sales of all formats shows some signs of increase, which may be related to the fact that the business scale of Spring Festival is higher than other quarters, which objectively magnifies this year-on-year change.
From the perspective of different formats, the year-on-year decline in the number of orders in big formats such as supermarkets/supermarkets has narrowed to be basically the same as last year, with a year-on-year decline of less than 3%. However, from the perspective of average cost per order, the year-on-year decline in the average cost per order of more than 7% has caused a greater drag. From the point of view of small supermarkets, convenience stores, grocery stores and other small formats, the drag of order quantity on sales year-on-year is greater than the impact of the decline in average cost per order. The number of orders has decreased by more than 5% year-on-year, and the largest grocery store has reached 11%, while the average cost per order has decreased by less than 5%.
(2) Full format, year-on-year situation of each city level.
The offline retail monitoring network of instant win brand CT covers cities at or above the county level (excluding townships, towns and villages) and deeply covers the core urban agglomerations in China. We pulled the relevant data of 2025Q1 of each city level and observed the year-on-year situation.
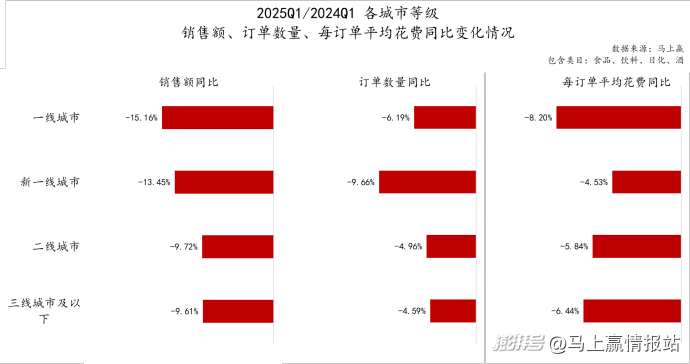
Similar to the business situation, in this quarter, from the first-tier cities to the third-tier cities and below, regardless of the sales volume, the number of orders or the average cost per order, all cities showed a relatively obvious year-on-year decline.
In terms of city level, from first-tier cities to third-tier cities and below, the year-on-year decline in sales is negatively correlated with the year-on-year decline in city level, that is, the higher the city level, the more obvious the decline; On the contrary, the lower the city level, the less the decline. Under the pressure of economic growth, consumers in first-tier cities are indeed facing greater pressure and more uncertain future expectations, which is also reflected in the basic consumption of food and beverage in the retail market. In the year-on-year average cost per order, the year-on-year decline of first-tier cities is also significantly higher than that of other cities, or it is closely related to the mentioned factors.
Unlike sales and average cost per order, which more represent consumers’ shopping budget and price mentality, the number of orders can more reflect the changes in population and consumer behavior and channel selection. It can be seen that the year-on-year decline of new first-tier cities is significantly higher than that of other cities. Comparatively speaking, consumers in second-tier cities, third-tier cities and the following two cities have smaller year-on-year changes.